Observe the memory layer with EverOS and Langfuse
Memory is the one layer of the agent stack that observability usually can't see. This integration makes an agent's memory operations visible in Langfuse: what got stored, what a query recalled, how confident that recall was, and what the memory layer cost in tokens.
Scope of this page (v1). This uses a thin OpenTelemetry wrapper shipped in the EverOS repo under
examples/langfuse/. Native, opt-in instrumentation is landing in EverOS; once it ships you'll enable tracing with a config flag and this page will be updated. The span model and Langfuse conventions are identical either way.
What is EverOS?
EverOS is an open-source (Apache-2.0), local-first memory runtime for AI agents. Conversations and agent trajectories are extracted by an LLM into user profiles, episodic memories, agent cases and reusable agent skills; stored as human-readable Markdown; indexed in SQLite + LanceDB; retrieved via hybrid BM25 + vector recall with reranking; and consolidated over time by an offline reflection engine. It runs as an HTTP service (pip install everos).
What is Langfuse?
Langfuse is the open-source platform for LLM observability, evaluation, and prompt management. It ingests OpenTelemetry traces natively, so any system that speaks OTLP, including EverOS, shows up next to the rest of your agent's traces, with model-usage/cost views, scores, and dashboards.
How it maps
Each EverOS API call becomes one Langfuse trace, with the server-side pipeline stages as typed child observations:
| EverOS operation | Langfuse observation | What becomes visible |
|---|---|---|
POST /api/v1/memory/add | span everos.memory.add | messages buffered per session |
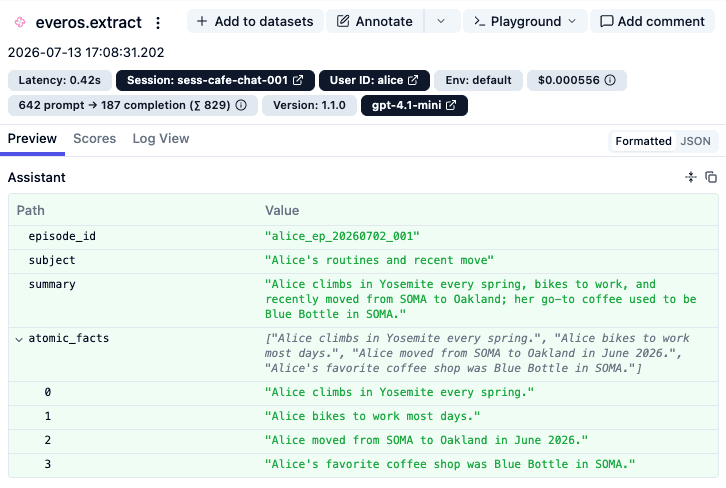
POST /api/v1/memory/flush → LLM extraction | generation everos.extract | model + tokens, so Langfuse can compute the cost |
| markdown persistence | span everos.persist.markdown | the .md files written |
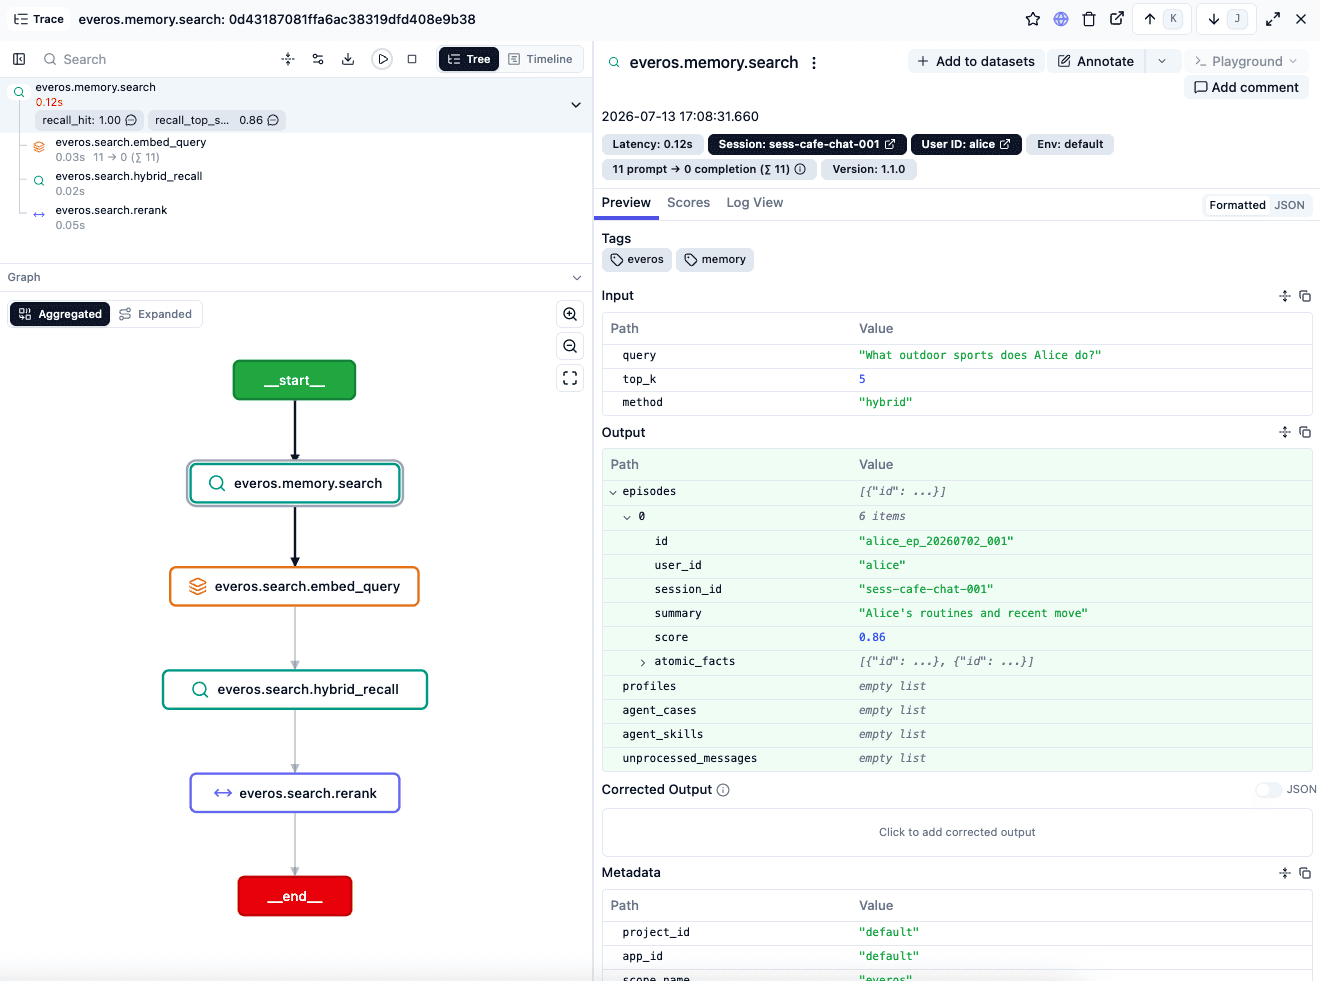
POST /api/v1/memory/search | retriever everos.memory.search | query, top_k → episodes/facts + fused scores |
| query embedding | embedding everos.search.embed_query | embedding model + tokens |
| hybrid recall + rerank | retriever / span | BM25 + vector candidate funnel, rerank scores |
POST /api/v1/ome/trigger | agent everos.ome.<strategy> | reflection / consolidation / skill evolution |
Index sync (SQLite → LanceDB) runs asynchronously in EverOS, so it surfaces as its own correlated trace rather than a child of add. Recall-quality signals are pushed as Langfuse scores (they're first-class objects, not span attributes).
Quick Start
You can run this without deploying EverOS. The example ships a mock transport that returns EverOS-API-shaped responses, so you'll see real traces in Langfuse in a couple of minutes. Point it at a real server when you're ready (see Run against a real EverOS server).
Install
pip install opentelemetry-sdk opentelemetry-exporter-otlp requestsCreate a Langfuse project and get your keys
Sign up for Langfuse Cloud (or self-host). Create a project and copy your API keys from the project settings.
Set your environment variables
LANGFUSE_PUBLIC_KEY="pk-lf-..."
LANGFUSE_SECRET_KEY="sk-lf-..."
LANGFUSE_HOST="https://cloud.langfuse.com"  # 🇪🇺 EU; US region: https://us.cloud.langfuse.com

# Optional: leave unset to use the built-in mock; set to trace a real server
# EVEROS_BASE_URL="http://localhost:8000"
Get the example
Both files live in the EverOS repo under examples/langfuse/:
everos_langfuse.py: the OpenTelemetry wrapper (pure OTel SDK, no Langfuse package dependency)demo.py: a runnable end-to-end example with a built-in mock
Copy them next to your code (or clone the repo).
Run a memory lifecycle
python demo.pyWith no EVEROS_BASE_URL set, demo.py uses the built-in mock, so you get real traces in Langfuse without deploying anything. It replays a full lifecycle: ingest → extraction → recall (including an updated fact outranking a stale one, and a deliberate miss) → an agent-skill recall → reflection. The core of demo.py looks like this (shown against a real server; with no EVEROS_BASE_URL it swaps in the built-in mock):
from everos_langfuse import HTTPTransport, InstrumentedEverOS, init_tracing, force_flush

init_tracing(service_name="everos")   # exports to Langfuse when LANGFUSE_* env is set
ev = InstrumentedEverOS(HTTPTransport("http://localhost:8000"))

session, user = "sess-cafe-chat-001", "alice"
ev.add(session, [{"sender_id": user, "role": "user", "timestamp": 0,
                  "content": "Actually, I moved from SOMA to Oakland last month."}],
       user_id=user)
ev.flush(session, user_id=user)                       # extraction (generation w/ tokens) → persist → index
ev.search("Where does Alice live now?",               # recall + recall_top_score / recall_hit
          user_id=user, session_id=session)
ev.trigger_ome("reflect_episodes", user_id=user, session_id=session)   # reflection
force_flush()
Open your Langfuse project: each call appears as a trace under the everos service, tagged everos / memory, grouped by session.id and user.id. Searches carry recall_top_score / recall_hit scores.
See it in Langfuse
Run against a real EverOS server
The quickstart above uses a mock by default so you can see traces immediately. To trace a real deployment, set EVEROS_BASE_URL to your running server; demo.py then routes calls through HTTPTransport instead of the mock.
What a real server surfaces today: one trace per memory operation (add / flush / search / reflection) with real end-to-end latency and inputs/outputs, grouped by session.id / user.id, and, for search, real recall-quality scores (derived from the response, see below). The per-stage child observations (LLM extraction with token usage, embedding, hybrid recall, rerank) render in the mock demo and will surface for real deployments once EverOS's native, opt-in instrumentation ships (see the scope note above); the wrapper deliberately does not fabricate them from a server that doesn't expose them yet.
You'll need an EverOS server with its model backends configured (an LLM for extraction/reflection, plus embedding and rerank models). See the EverOS quickstart to start one (pip install everos).
What you can see in Langfuse
The mock demo shows the full picture below; a live server today shows the top-level operation spans plus real recall scores (see Run against a real EverOS server).
- The full memory lifecycle as trace trees:
add→extract→persist, andsearch→embed→hybrid recall→rerank, each stage timed. - The cost of remembering: extraction and reflection are
generationobservations carryingmodel+ token usage, so Langfuse computes their cost in the model-usage views. - Recall quality over time: each search attaches proxy scores (the fused/reranked top-hit score, and a 0/1 hit against a threshold) via the scores API, derived from the search response, so this works against a live server today. These are the engine's own confidence signals, useful to plot and trend, but not ground-truth relevance. For true relevance evaluation, run an LLM-as-judge over the query + recalled content in the trace (see Evaluation).
- Per-session / per-user views: filter and group memory activity by
session.idanduser.id.
Privacy. Traces carry non-sensitive metadata (latency, token counts, model names, scores) by default. Capturing raw query or memory content is opt-in, and the demo's
public_tracesflag is only for synthetic data; never enable it for real memory content.
Resources
- EverOS on GitHub
- Integration example (
examples/langfuse/) - Raven, the self-improving agent harness built on EverOS
- Langfuse OpenTelemetry docs
Interoperability with the Python SDK
You can use this integration together with the Langfuse SDKs to add additional attributes to the observation.
The @observe() decorator provides a convenient way to automatically wrap your instrumented code and add additional attributes to the observation.
from langfuse import observe, propagate_attributes, get_client

langfuse = get_client()

@observe()
def my_llm_pipeline(input):
    # Add additional attributes (user_id, session_id, metadata, version, tags) to all spans created within this execution scope
    with propagate_attributes(
        user_id="user_123",
        session_id="session_abc",
        tags=["agent", "my-observation"],
        metadata={"email": "user@langfuse.com"},
        version="1.0.0"
    ):

        # YOUR APPLICATION CODE HERE
        result = call_llm(input)

        return result

# Run the function
my_llm_pipeline("Hi")
Learn more about using the Decorator in the Langfuse SDK instrumentation docs.
The Context Manager allows you to wrap your instrumented code using context managers (with with statements), which allows you to add additional attributes to the observation.
from langfuse import get_client, propagate_attributes

langfuse = get_client()

with langfuse.start_as_current_observation(
    as_type="span",
    name="my-observation",
    trace_context={"trace_id": "abcdef1234567890abcdef1234567890"},  # Must be 32 hex chars
) as observation:

    # Add additional attributes (user_id, session_id, metadata, version, tags)
    # to all observations created within this execution scope
    with propagate_attributes(
        user_id="user_123",
        session_id="session_abc",
        metadata={"experiment": "variant_a", "env": "prod"},
        version="1.0",
    ):
        # YOUR APPLICATION CODE HERE
        result = call_llm("some input")

# Flush events in short-lived applications
langfuse.flush()
Learn more about using the Context Manager in the Langfuse SDK instrumentation docs.
Troubleshooting
No observations appearing
First, enable debug mode in the Python SDK:
export LANGFUSE_DEBUG="True"Then run your application and check the debug logs:
- OTel observations appear in the logs: Your application is instrumented correctly but observations are not reaching Langfuse. To resolve this:
- Call
langfuse.flush()at the end of your application to ensure all observations are exported. - Verify that you are using the correct API keys and base URL.
- Call
- No OTel spans in the logs: Your application is not instrumented correctly. Make sure the instrumentation runs before your application code.
Unwanted observations in Langfuse
The Langfuse SDK is based on OpenTelemetry. Other libraries in your application may emit OTel spans that are not relevant to you. These still count toward your billable units, so you should filter them out. See Unwanted spans in Langfuse for details.
Missing attributes
Some attributes may be stored in the metadata object of the observation rather than being mapped to the Langfuse data model. If a mapping or integration does not work as expected, please raise an issue on GitHub.
Next Steps
Once you have instrumented your code, you can manage, evaluate and debug your application:
Manage prompts in Langfuse
Add evaluation scores
Run LLM-as-a-judge Evaluators
Create datasets
Create custom dashboards
Test queries in the Playground
Last edited
